
By Dr. David Wetzel — INCOSE
A common image of metrics on posters and the internet is of a triangle with “Good,” “Fast,” and “Cheap” on each side and the saying “Pick Two” in the middle. The implication is that if you pursue any two of them, then the third one suffers. For example, if you want good and fast, then it costs more. The biggest issue with this triangle-view of metrics is that “good” usually means yields, defects per million, or failure rates, which are all productivity rate metrics and not quality metrics. We need a more robust model to untangle quality metrics from productivity, timeliness, and financial metrics. We call this model the “Family of Measures.” We have used this model over the past three decades to help organizations evaluate existing metric systems; differentiate order winners from market entry metrics; evaluate trends, articles, books, and claims; illustrate the Deming chain reaction and Taguchi loss function; explain why reliability metrics are quality metrics; create truly balanced scorecards; and even illustrate history. The sincere hope is that the Family of Measures reveals fresh insights into metric development and gives you an additional tool to make better data-based decisions.
Four Distinct Metrics
Organizational performance metrics are like the periodic table in chemistry (Figure 1).
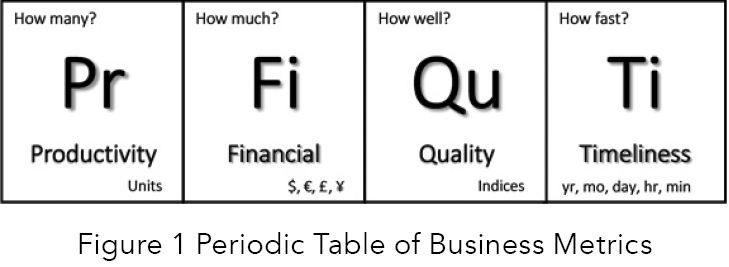
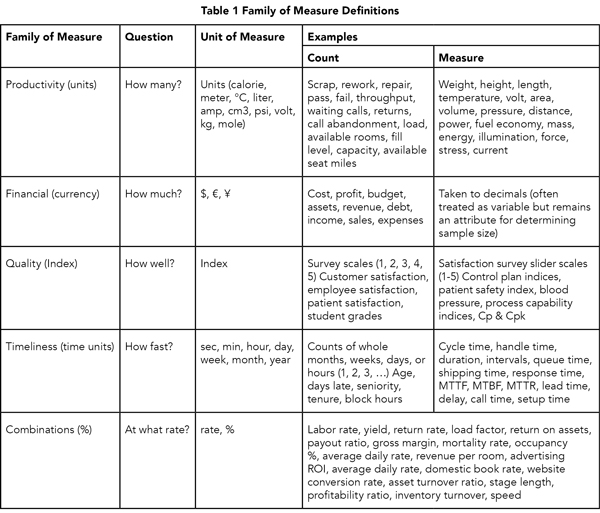
There are base elements, or metrics: productivity, financial, quality, and timeliness. These building blocks can be used as standalone metrics or combined to form compounds (i.e., rates and percentages). There are two easy ways to identify and separate the four metrics. Each metric answers a different question and has a different unit-of-measure. For example, if the unit-of-measure is currency (e.g., dollars, yen, euro), then the metric type is financial. If the unit-of-measure is an index (e.g., customer satisfaction, process capability index), then the metric type is quality. If the unit-of-measure is time (e.g., seconds, days, years), then the metric type is timeliness. If the unit-of-measure is units, (e.g., counts, °F, grams), then the metric type is productivity. The second way to differentiate the four metrics is to understand what question is being asked. Financial metrics ask, “How much?” Productivity measures ask, “How many?” Timeliness metrics ask, “How fast?” Quality metrics ask, “How well?” All four base metrics can be either counts (attributes) or measures (variable). Table 1 (below) is a summary of the two ways to differentiate the four metrics, including examples and definitions.
Of the four metrics, financial and timeliness metrics are the most intuitive. We have been counting money and telling time since grade school. It is the other two, productivity and quality, that give organizations trouble. Two interrelated problems exist. First, there is the common practice of defining quality with productivity, financial, or timeliness metrics. These substitutions and misconceptions hinder the creation of true quality metrics. Especially, they hinder the development of leading indicators of process quality that would improve variability, stability, and capability.
A Universal Concept
The four metrics are represented in many fields of study. Project management embeds the Family of Measures in its core knowledge areas: scope management, time management, cost management, and quality management (Project Management Institute, 2008). Scope, activity planning, and the work breakdown structure are productivity elements. Timeliness is represented by the schedule, displayed with Gant charts and networks. The project budget is the financial portion. Variance indices represent quality efforts. Project risk management (FMEA) also contains the family of measures embedded in severity (quality), detection (productivity), and occurrence (timeliness or productivity, depending on the scale). Logistics is another example of this universal concept. Logistics has five objectives: right product and place, right time or faster, right price/cost, and right condition (Stock and Lambert, 2001). The Family of Measures is a reoccurring schema that appears in all disciplines, although each may be worded differently.
Productivity versus Quality Metrics
The Taguchi Loss Function (Deming, 2000) is probably the best illustration of the difference between productivity and quality. A simple loss function is a step function between two states of a switch (on/off). The light is either on or off. Figure 2 illustrates production yields as a loss function.
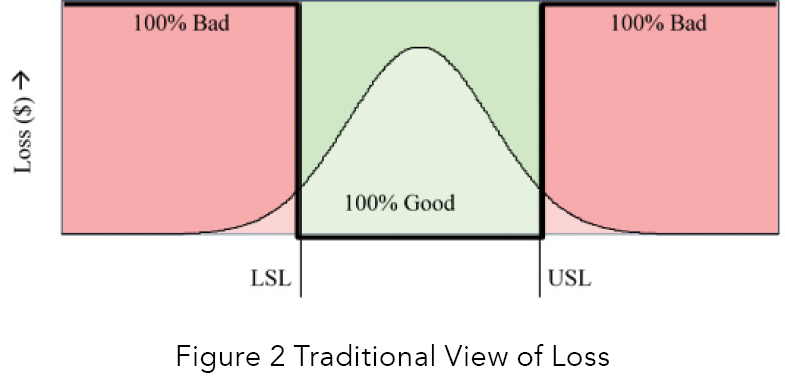
Production, viewed in this way, is either on (100% good) or off (100% bad). We use the following questions to explore this widely-held view of production:
- Is there a “happy” zone?
- Is there a sense of loss all the time?
- Which Family of Measure is illustrated in the figure?
- What question does this metric answer?
There is absolutely a “happy zone” when things are deemed 100% good. No process improvement efforts will be taken under these “happy” conditions. There is no feeling of loss under these conditions. When the product or service is deemed bad, a feeling of 100% loss exists, and problem-solving techniques are employed to regain control. This feeling of 100% good or 100% bad is binomial. It is a productivity metric. What we produced is either good or bad. How many good or bad? Yields are either calculated directly from counts; or measured, dispositioned, and then totaled as good or bad. Two problems occur as a result of this version of process management: (1) productivity yield metrics are used to monitor the process, masquerading as quality metrics; and, (2) problem solving is the predominant method used to “improve the process” when things are bad.
An alternative to this process management strategy is illustrated in Figure 3.
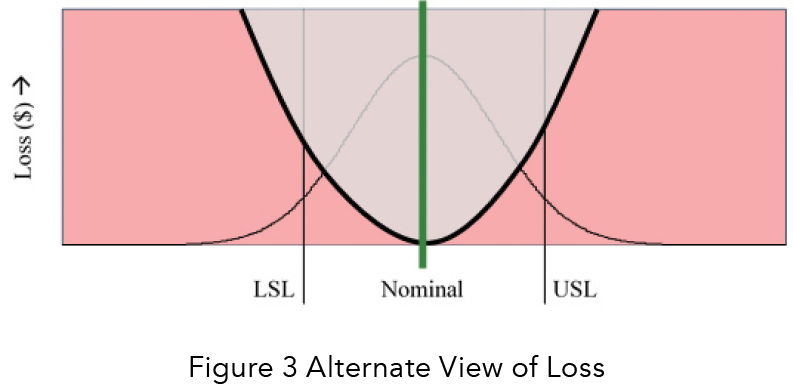
- Let us apply the same series of questions. There is no “happy zone” because the process aims to meet nominal. The odds of being exactly on nominal are small; thus, a sense of loss always exists and increases as we stray from nominal. This feeling leads to continuous process improvement efforts to center the process better and continuously reduce variability.
Most importantly, improvement efforts continue even when the product or service is within tolerance (deemed good). The primary question is, “How good or bad?” This question is a true quality metric. What we produce may be either good or bad, but we also want to know the degree of goodness or badness or to answer the question, “How well?” To do this, we measure variability, central tendency, and the stability of a process. We compare our process to customer specifications and calculate process capability and process management indices. The idea is not to reach an arbitrary goal, but to continuously improve the process.
Two profound differences occur as a result of this version of process management: (1) quality indices are used to monitor the health of the process (with throughput, yields, cycle time, costs, and other metrics), and, (2) continuous improvement is the method used to improve the process. To appreciate the difference between the two competing views of process management, one would need to understand all the organizational factors that promote the traditional productivity-focused step function version (the “hero” mentality, competitive reward systems, discomfort with statistics, overreliance on audits and inspections); a discussion of which is well beyond the scope of this article.
Need for Order Winners
Most companies operate on a half-set of metrics (productivity and financial), sprinkling in some operational-level timeliness indicators, but mostly excluding quality altogether. They think they are measuring quality, mostly with yields, and then wonder why customer complaints and warranty costs are rising, while market share and repeat business are declining. The ever-increasing presence of global competition is not going away. Our needs are urgent: the need to stop degrading rich timeliness and quality metrics into simple percentages; the need to differentiate between productivity and quality; and the need to develop leading indicators of quality. Family of Measures is a tool that helps address these needs through the reexamination and delineation of metrics into distinct metric families.
References
- Project Management Institute. A Guide to the Project Management Body of Knowledge (PMBOK Guide), fourth edition. Newtown Square, Pennsylvania; Project Management Institute, Inc., 2008.
- Stock, J., and Lambert, D. Strategic Logistics Management, fourth edition. New York: McGraw-Hill Irwin, 2001.
Deming, W. Edwards. The New Economics for Industry, Government, Education, second edition. Cambridge: MIT Press. 2000.

Dr. David Wetzel
Dave Wetzel is a Lean Six Sigma Master Black Belt with over 30 years of work experience in the industrial, service, and public sectors as a process improvement engineer, facilitator, trainer, and course developer. He has a Ph.D. in Industrial and Systems Engineering from The Ohio State University, an M.S. in Engineering Management from Rensselaer Polytechnic University, and a B.S. in Chemical Engineering, also from OSU. Dave has held several different ASQ certifications: quality engineer, black belt, and quality technician. Dave has worked in Europe, Asia, the Middle East, and the Americas with such organizations as Dell, TVA, IBM, GE, Chemetall, RIT, Nationwide Insurance, Samsung, Eli Lilly, DeCA, the George Group, McKee Foods, the U.S. Army, and Xerox. Dave is responsible for the Manufacturing Systems Engineering program at Weber State University. Dave can be reached at dwetzel73@gmail.com or 585.752.2758.

INCOSE
The International Council on Systems Engineering (INCOSE) fosters world-class systems engineering environment for its current and future membership. The local Wasatch chapter was chartered in January 1997 to serve the Utah systems engineering community.
We believe that systems engineering principles and practices offer the best solution for Utah companies and organizations competing in our present-day global marketplace, and that the proper application of systems engineering can contribute to the overall betterment of the social, economic, and environmental condition of our area. When the aim is to improve cost, quality, and schedule performance — whether in industry, government, or education — we believe that systems engineering provides the most viable structured approach for doing so.